
The programmes provided by the programme companies are transmitted from the Authority’s stations. The system of 22 transmitters which now covers about 96 per cent of the population of the United Kingdom had to be developed by using a group of six channels in the frequency Band III, allocated to the Authority by the Postmaster-General. No direct experience of operating programme services in Band III in this country was available to guide the Authority’s engineers in the development of Band III, and they and the manufacturers had to start virtually from scratch. None-the-less, within three years, three-quarters of the population had been given access to Independent Television programmes. The extension of coverage is traced in the maps and tables which follow. The story of this engineering achievement is told more fully in the chapter “Technical Achievements”.
The Growth of Coverage
| End of year | Cumulative population coverage (thousands) | Percentage of total UK population % |
|---|---|---|
| 1955 | 12,290 | 24 |
| 1956 | 30,116 | 59 |
| 1957 | 33,666 | 66 |
| 1958 | 38,900 | 76 |
| 1959 | 44,366 | 86 |
| 1960 | 45,016 | 88 |
| 1961 | 48,587 | 94 |
| 1962 estd. | 50,981 | 96 |
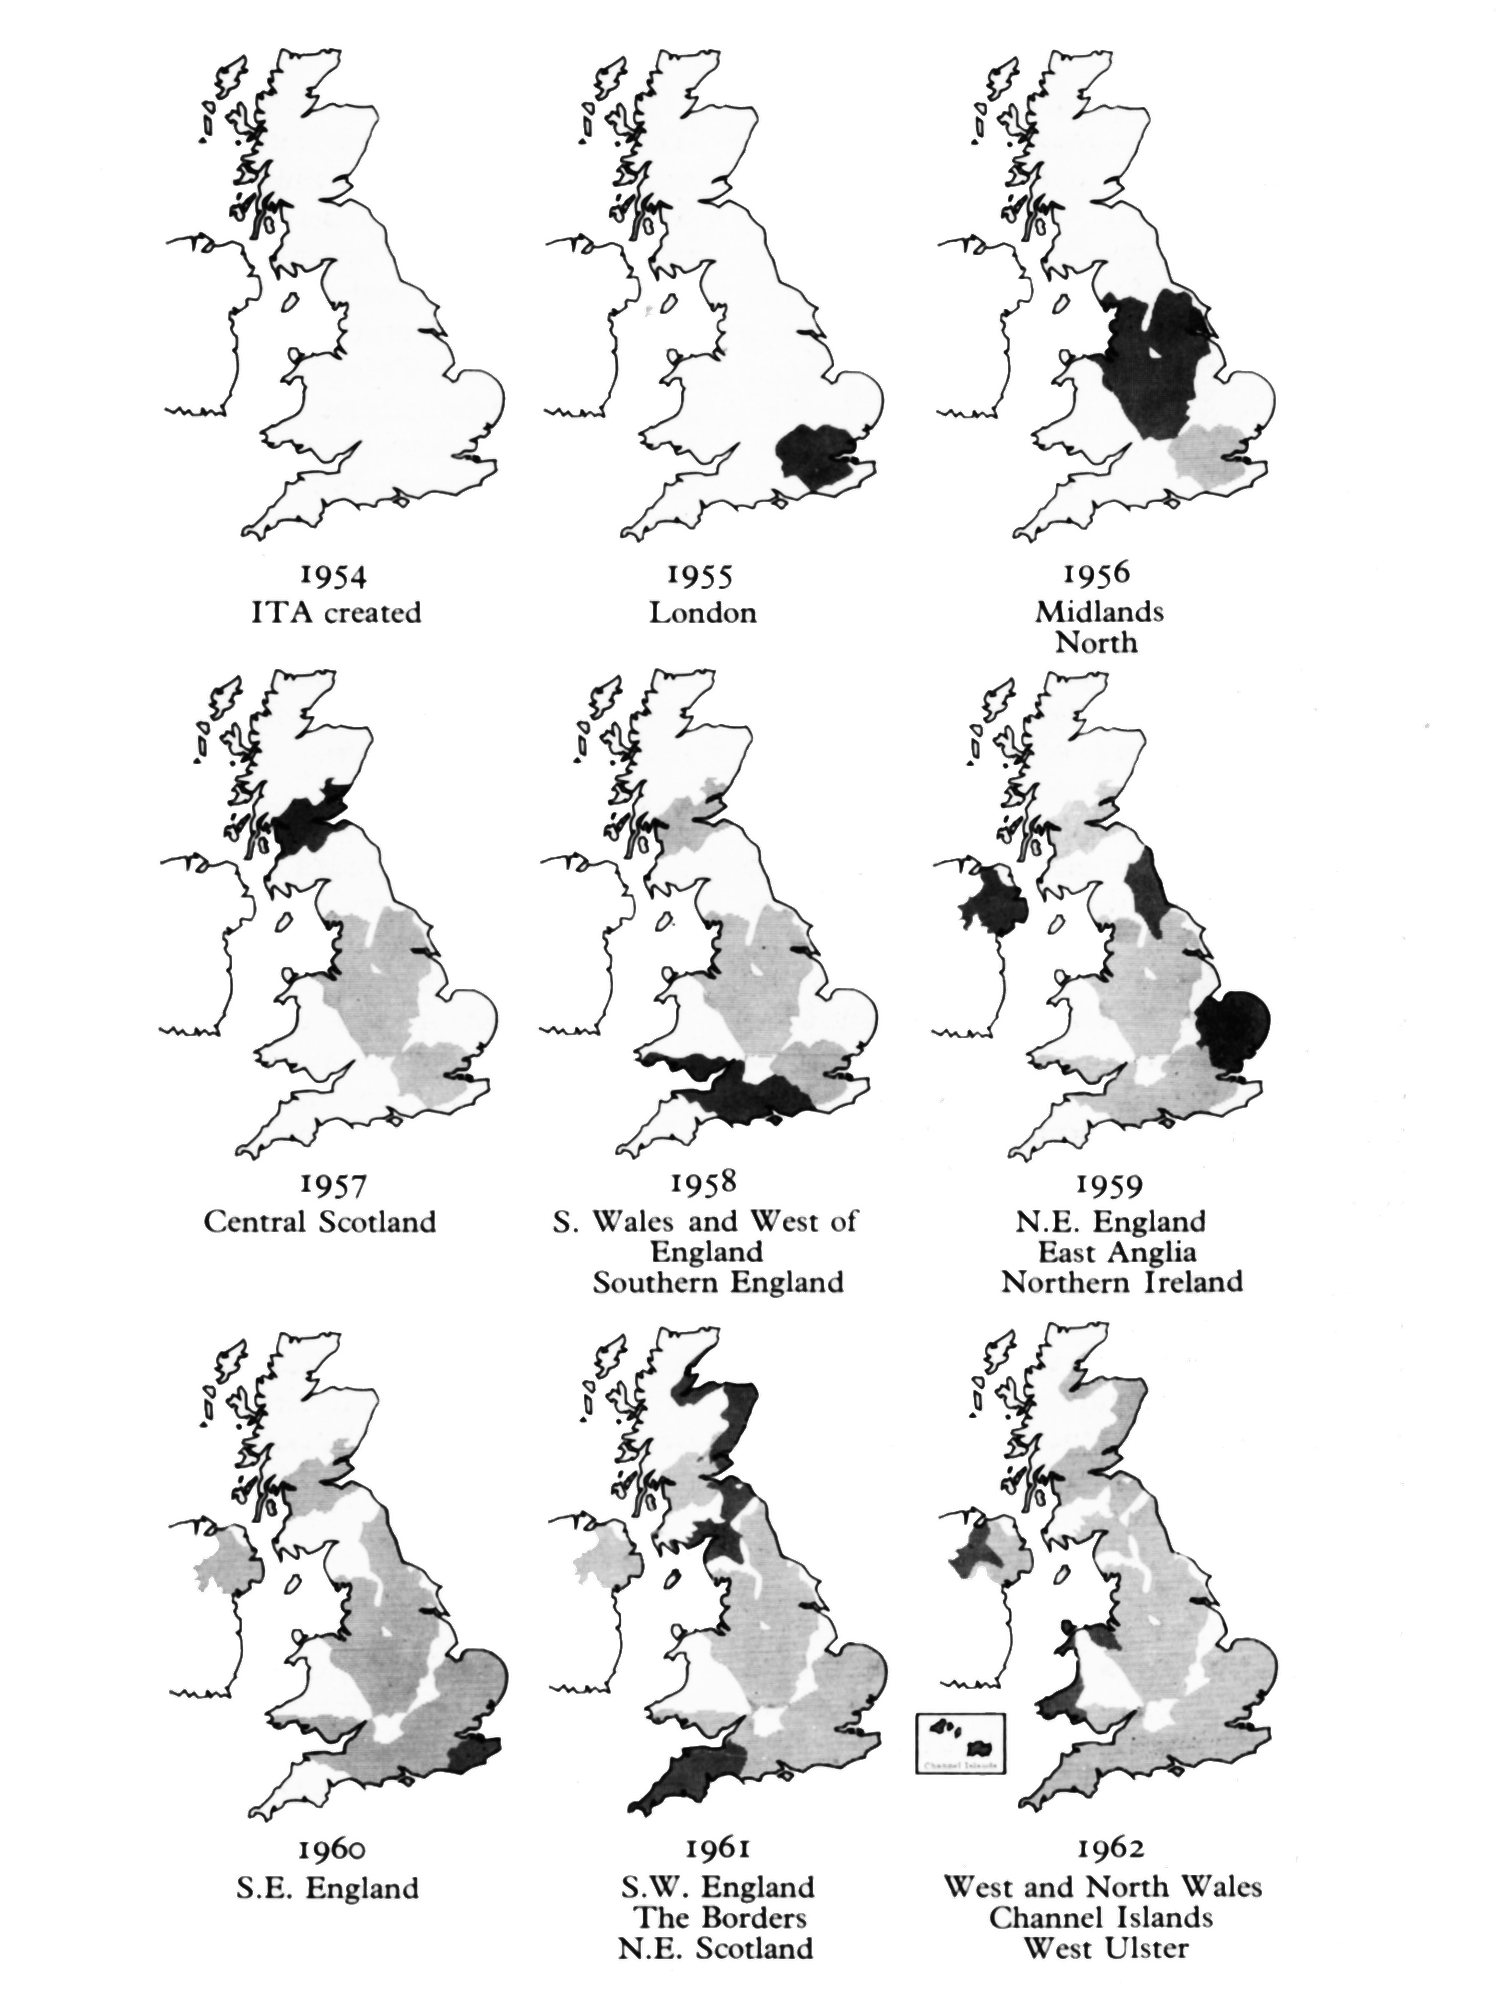
THE SPREAD OF INDEPENDENT TELEVISION is progressively traced in these nine maps. The Television Act was passed in July 1954 and the Authority first met in August. The service began from Croydon on 22nd September 1955. The service areas shown in the final map include about 96 per cent of the population.
The Growth of I.T.A. Homes
| End of year | Cumulative ITA homes (thousands) | Percentage of all TV homes | Percentage of all homes |
|---|---|---|---|
| 1955 | 495 | 30.8 | 12.5 |
| 1956 | 2,656 | 53.3 | 25.8 |
| 1957 | 4,684 | 69.2 | 39.6 |
| 1958 | 6,540 | 75.9 | 46.6 |
| 1959 | 8,605 | 80.8 | 55.2 |
| 1960 | 10,292 | 87.0 | 65.4 |
| 1961 | 11,282 | 88.3 | 68.9 |
| 1962 estd. | 12,300 | 90.0 | 73.0 |